About the Survey:
The Occupier Sentiment Survey is an exploration on occupier-side insights regarding the real estate strategies of office locators in the Philippines for the next three to five years, as well as a high-level assessment of their level of adoption of sustainability.
The survey was participated by various stakeholders from office occupiers coming from different sectors and industries. After thorough screening, answers from 95 respondents holding the ranks of manager and up were analyzed in order to get a glimpse of the future of the workplace.

Fifty-nine percent of the respondents come from various subsectors of the Information Technology and Business Process Management (IT-BPM) sector. The share of the sector in the respondents can be considered representative of Philippine office occupiers as IT-BPM continues to be the major demand driver of office space in the country.
Combination of BPO-shared services/captive/KPO, BPO-third party services, and information technology & communications


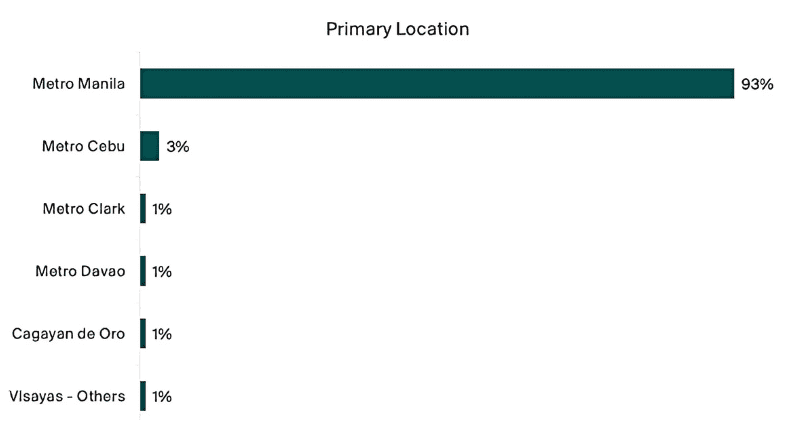
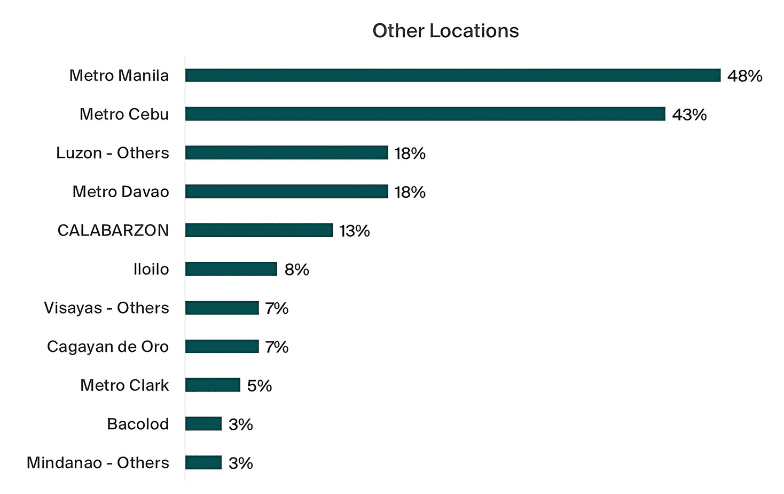
Meanwhile, in terms of geographic presence, 64% of respondents come from companies with multiple locations in the Philippines, wherein 17% come from companies with more than 10 sites nationwide. While one of three runs of the survey was done in Cebu, almost 93% of respondents still came from companies primarily located in Metro Manila.

Real Estate Strategy
The first portion of the Occupier Sentiment Survey focuses on the real estate strategies of the respondents for the next 3 to 5 years.
There are four general options for the real estate strategy for which respondents can choose more than one:
- Changes in footprint in their current location/s – changes in leased area, whether increase or decrease
- Expansion – new lease acquisition without giving up currently occupied spaces
- Relocation– leaving current location and transferring to a different one
- Changes in the office design or layout – changes in the physical aspects of currently leased spaces without changing footprint

Among the four, expansion received the highest share of responses at 64%, followed by layout or design changes at 22%, then by changes in footprint in existing locations at 19%, and finally by relocation at 13%.
Read the next part of the report here.
- Tags:


